
Using MATLAB for Simple Image Processing
Get a basic insight on Image Processing using MATLAB.

Image Processing is a raging field that deals with the process of converting an input image into a usable format. This image can now be used for various purposes like medical imaging and radar imaging. The entire image lifecycle encompasses all the steps from obtaining an image, enhancing it to a subjectively better format for use, restoring its naturality, adding colors digitally, multi-resolution and wavelet processing, image compression, morphological description, segmentation, sampling, quantization, and finally, presenting. The most interesting part of Image Processing is undoubtedly image enhancement. Image enhancement accepts image inputs and converts them into image outputs with enhanced interpretability and perception. Image enhancement is used generally for sharpening, noise reduction, brightness manipulation, and so on.
Languages like Python and MATLAB could be used for image processing. While some features of Python do weigh over MATLAB, we shall be using MATLAB for beginner-level image processing. This is because MATLAB has a lot better code-readability than Python. This is ultimately useful for a lot of beginners who are just starting into image processing and do not have prior programming experience. MATLAB also has an interactive user interface with umpteen in-built features. However, MATLAB does require licensing while Python is open source.
READING IMAGES
To start with image processing, the first step is to read digital images. MATLAB has an in-built function called imread() for reading input images. It is important to note that MATLAB accepts and delivers inputs/outputs as matrices. All the calculations are done by reading images as matrices.
%syntax
imread('filepath\name.ext');
Note that once you run this command without the semicolon, it would still execute perfectly. However, you would see lengthy matrix calculations in your command window, and that might clog more of your RAM.
If you would like to call this function repeatedly, you may save it as any variable.
f=imread('filepath\name.ext')
In the aforementioned example, we have taken the variable to be 'f'.
SHOWING IMAGES
Once you have made MATLAB read the image in the form of a matrix, it becomes vital to visually perceive what the image is like in a visually comprehensive format. The MATLAB command imshow() is used to show the image read or processed. The default format for storing these images is .fig.
g=imshow(f);
The aforementioned code is used to show the image that was previously read and stored in the variable 'f'. Note that even if you type
imshow(f);
the command would still work perfectly. We have saved it in a variable 'g' for callable purposes.
WRITING IMAGES
Once you have seen what the read/processed image looks like, you may be happy with your results and may want to save it. The default format for saving an image in MATLAB .fig. However, images saved with the .fig extension tend to be importable, bulky, and are accessible only via MATLAB. To convert them in any easily accessible format like .tiff, .png or .jpg, the imwrite() function can be used.
imwrite(I, 'filepath\chosen_name.extension');
In the above example, an image 'I' is being stored in a chosen location(filepath) with the chosen name(chosen_name) and with an extension of the user's choice. Once you open the chosen location, you would see the desired image saved in the chosen format.
SPLITTING COLORED IMAGES INTO RGB CHANNELS AND RECOMBINING THEM
An extremely important point to be noted is that a colored image contains 3-dimensions: rows, columns, and color channels. 3 possible color channels are present in any colored image: red, green, and blue. To apply various filters and algorithms for image enhancement, an image could be decomposed into its respective channels, and the filters could be applied individually. This is because the effect a filter has on one channel may be different from its effects on other channels. Also, images on any given channel are greyscaled and have only 2 dimensions. Once you have obtained a suitable result on any channel, you may concatenate the result with the other channels to obtain the 3D-colored image.
R=I(:,:,1);
G=I(:,:,2);
B=I(:,:,3);
In this code, the variables R, G B contain the red, green, and blue channels respectively of an image 'I'. The colons (:) are used to indicate all the rows and all the columns respectively. The red channel is always the first one, the green the second one, and the blue channel the last one.
combined=cat(3,R,G,B);
To bring them back, the concat() function is called. and the respective channels are brought together again. The variable 'combined ' is used to denote the image, a combination of all three channels.
PLOTTING A HISTOGRAM
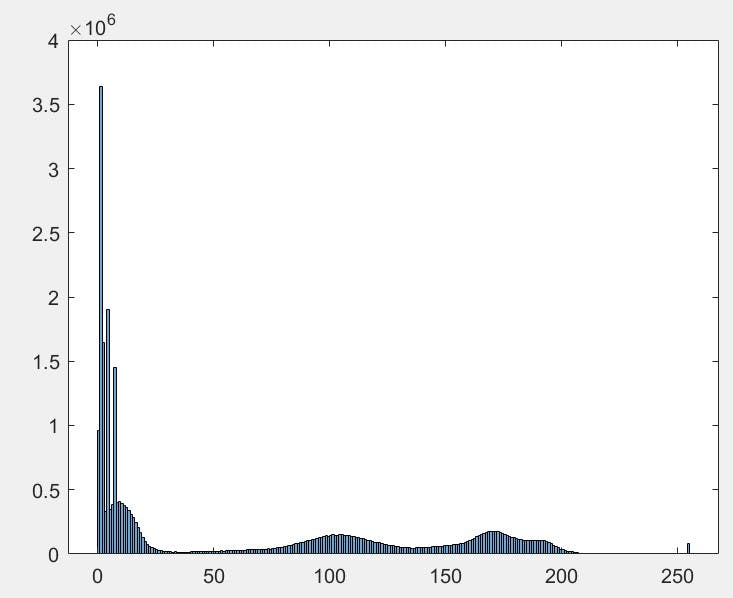
Any digital image can be viewed as a histogram to visualize the number of pixels corresponding to each intensity. Histograms highlight the distribution of the intensities. In order to plot the histogram of a digital image, a simple MATLAB command histogram() does the trick.
histogram(f);
This command can easily create a histogram of the digital image 'f'.
HISTOGRAM EQUALIZATION
Histogram equalization is a non-linear, monotonic modeling technique that uniformly distributes pixel intensity values in the dynamic range. Histogram equalization is predominantly used in contrast adjustment by evenly using the entire dynamic range of intensity values. Histogram equalization is particularly useful in enhancing X-ray, thermal, and satellite images. The histeq() function in MATLAB is used for histogram equalization and contrast increment.
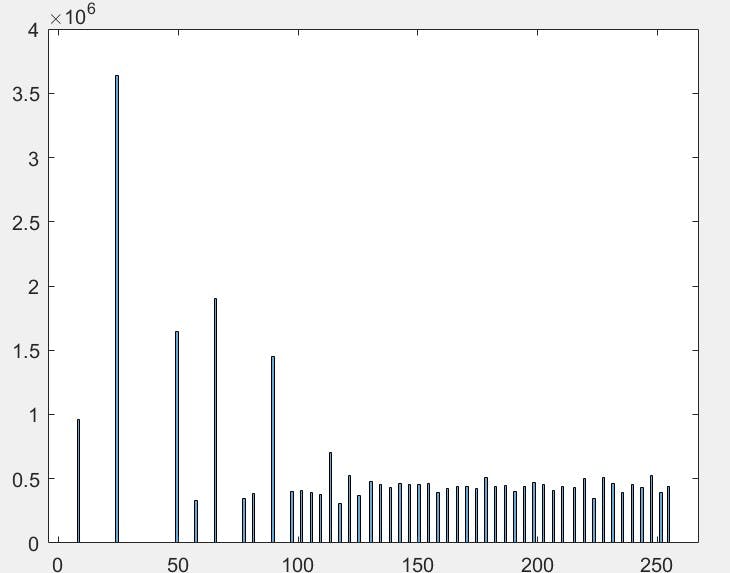 The aforementioned code is used to equalize the histogram of the digital image 'f' and then display the equalized histogram. As you can see, the dynamic range of the grey-level intensities has been stretched. Histogram equalization is an effective technique but it tends to increase the brightness of images and makes them look unrealistic.
I hope this basic insight on image processing using MATLAB was clear. If you have any problems, feel free to comment down and let me know. I would definitely help you out!